Analytics
PowerBI Visuals
PowerBI is the most widely used data analytics tool by professionals who require easy-to-use mapping and viewing functionality when creating reports. Microsoft supports the option to create own customized powerBI visuals for data analytics, business intelligence and reporting extending the basic possibilities. The visuals created by GeoAI BV are availible for everyone and can be downloaded from GitHub without any rights on support and free of charge. If you want to know more, need help creating reports, get your own visual build or want to obtain a supported version you can contact us for more information.

Products
Image Viewer
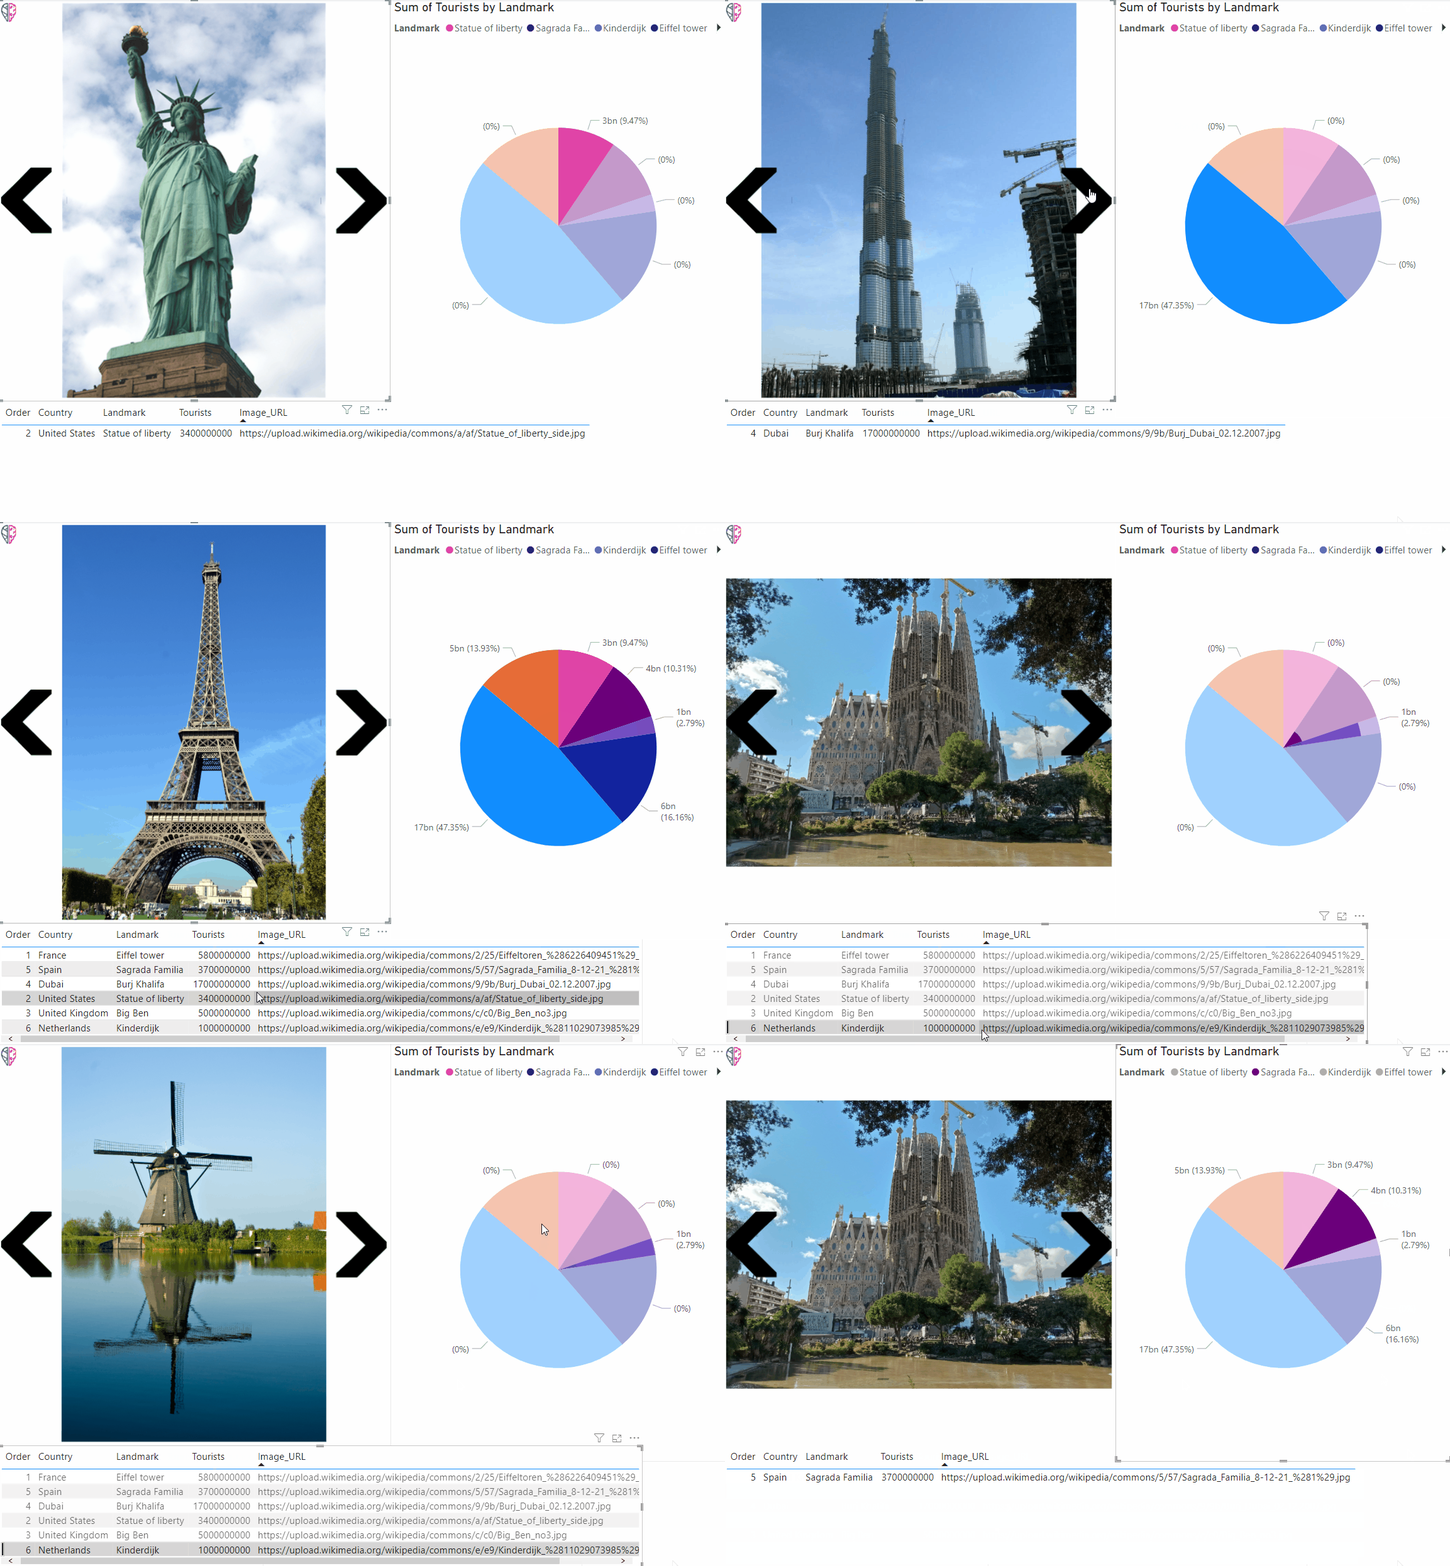
The ImageViewer is a simple-to-use Microsoft PowerBI visual for stepping through images by using the navigation arrows. The user can go forwards and backwards through a dataset which creates a single selection in the report. Ordering is determined by a user-defined data field and the image is shown based on a web URL. The image is selected and shown via both filtering and selection of items in other visualsI

Map Viewer
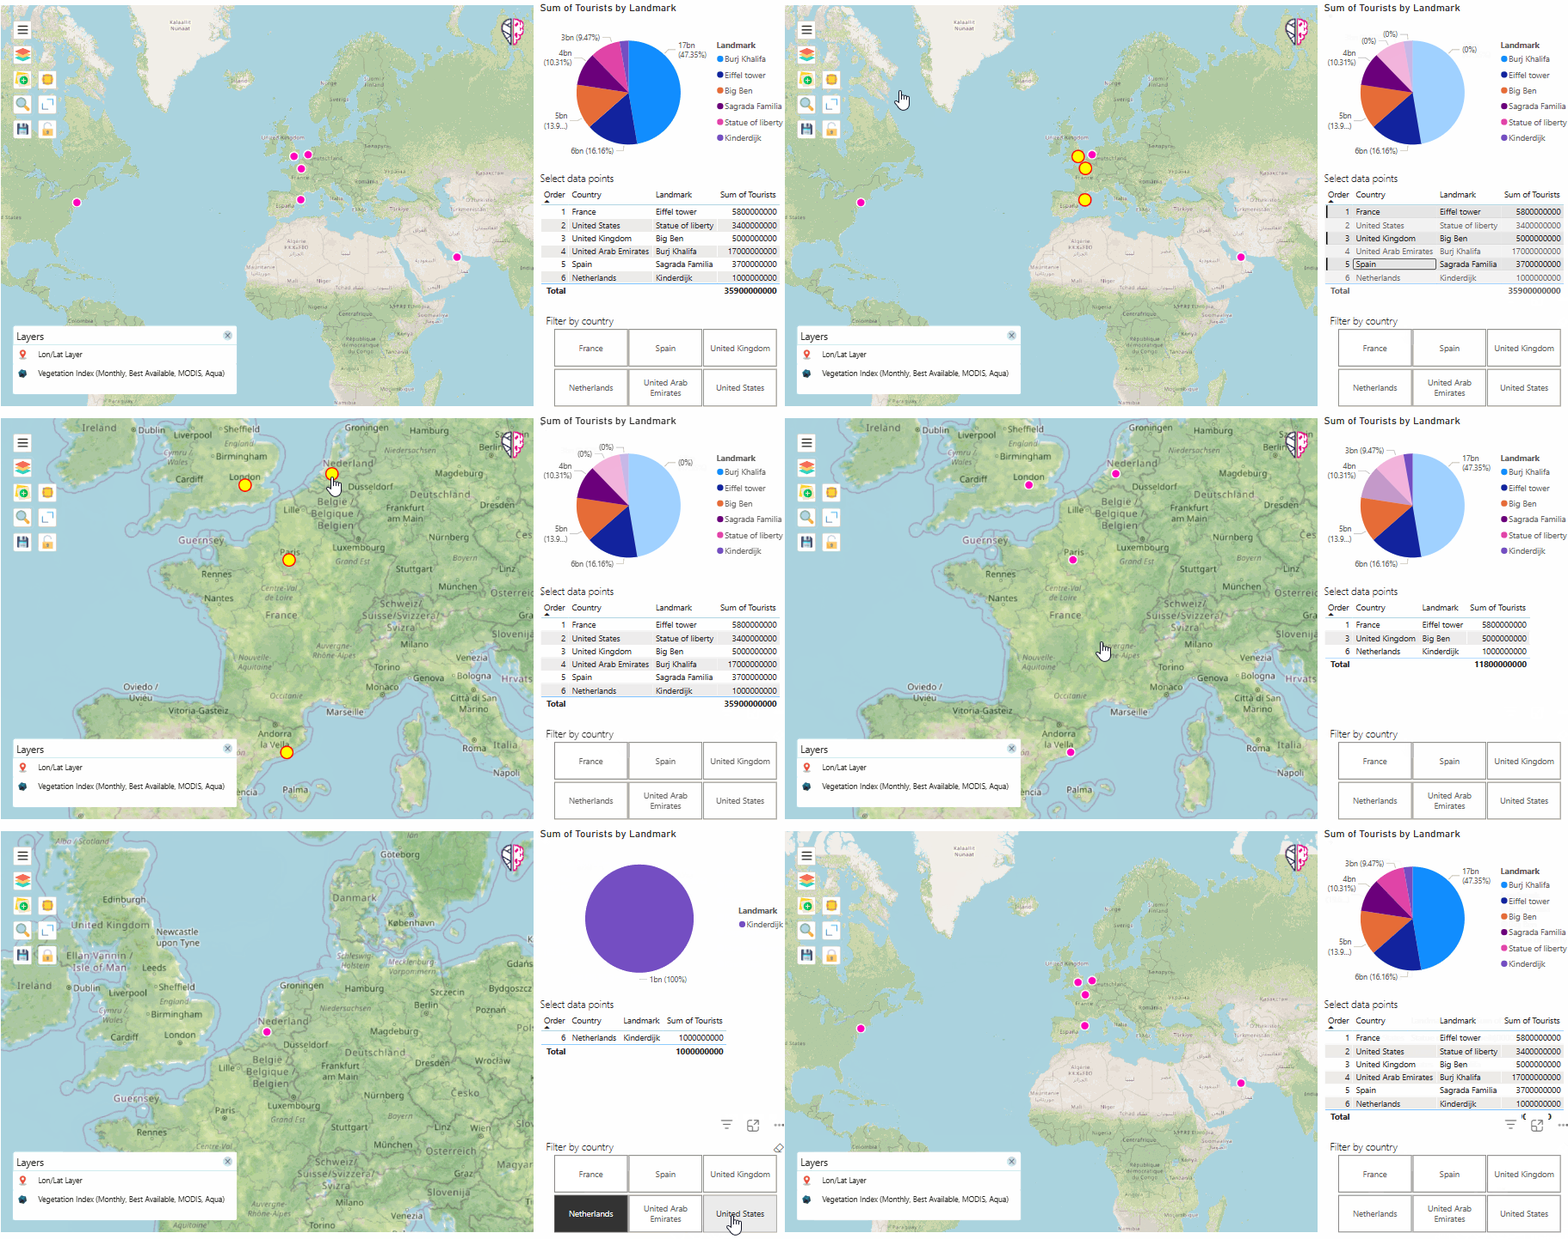
Our MapViewer brings the power of a highly-configurable map to your Microsoft PowerBI report. This feature-rich Visual lets you show locations in your report on a basemap of your choosing. Web Mapping Service (WMS) layers can be added to enrich your map with extra information. You can create a library of your favourite WMS endpoints and your layer styling and map extent is saved within the Power BI report.


